4 Things Microsoft Excel Can Do That Google Sheets Can't

There is an ongoing debate on which is better between Microsoft Excel and Google Sheets, but it may never end since both tools serve different audiences. Excel is widely known as the solution for professionals, organizations, and enterprises, especially those who require deep data analysis and modeling tools. Sheets is more suited for individuals and small teams who value modern workflows, as it makes collaboration and real-time editing easier. Although Excel also provides these features in both its desktop and web apps, it's not as seamless as in Google Sheets.
Regardless, Excel still remains at the top for many. It has been around since 1985, when it launched for the Apple Macintosh, and it has largely cemented itself as the go-to spreadsheet program. As such, it has had the time to develop a robust feature set compared to apps like Google Sheets (since 2006), which have to rely on plug-ins to implement some of the things Excel does natively.
Beyond advanced data analysis, you can easily work with large datasets, powerful data transformation tools, and robust forecasting and decision tools. Not to mention that it's also the true offline solution. There are more features, of course, but it would take an entire book to list them all. It's essential to stick to a few that make the biggest impact on people's everyday lives. This does not mean Google Sheets doesn't hold a candle to Excel — just that you can only rely on Excel for certain things.
A true offline experience

Google Sheets is a browser-based spreadsheet program with an online-first philosophy. Microsoft Excel, on the other hand, has always been offline-first. Once you download the desktop app, all its core functionality, including basic calculations, complex logic, conditional formatting, and statistical analysis tools, is available offline. What you won't have access to are the Microsoft Office cloud and AI features like real-time collaboration, OneDrive, and Copilot.
The major barrier to entry is that using the Excel desktop app isn't free. At a minimum, you need Office 365. This requires a Microsoft 365 subscription, which starts at $9.99 for the Personal plan. Alternatively, you can purchase Microsoft Office 2024 for a one-time fee of $179.99 for the Home edition or $249.99 if you also want the Business edition. However, this only gives you the classic version without the aforementioned cloud and AI features. The online version is free, but it has limited features and no offline mode.
You can work with Google Sheets offline, but you'll need to download the offline extension for Google Chrome and Microsoft Edge. Once you also enable offline mode in settings, you can create, view, and edit spreadsheets without an internet connection — it will save everything on the device instead of the cloud. For files that you created online, you need to make them available offline first before you can access them. You will be limited, though, with features like importing documents, tweaking settings, and spellcheck unavailable.
Clean and manipulate data graphically
Data doesn't always come in a clean format that you can start using right away. Sometimes, you can have duplicates, typos, extra spaces, and other issues that need fixing before it can be usable. Both Excel and Sheets have functions and features that allow you to get it in a format that makes it easy to visualize and analyze. However, Excel has one thing up its sleeve that is considered a game-changer: Power Query.
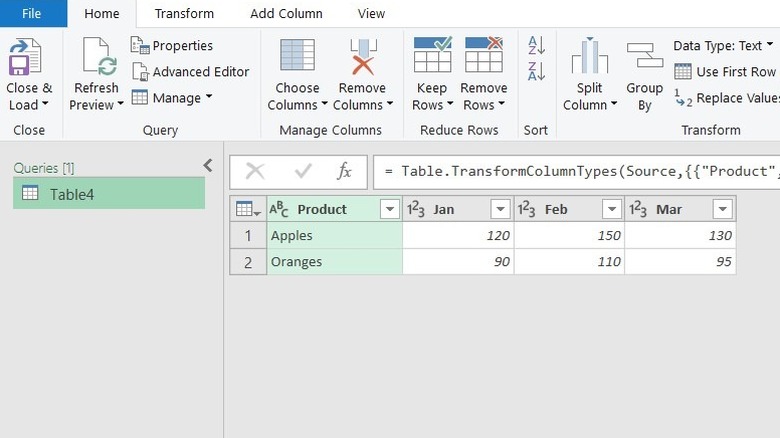
Power Query is Excel's native graphical ETL (Extract, Transform, and Load) tool. It allows you to import data from various sources, such as tables, text files, spreadsheets, PDFs, databases, the web, and cloud services. Afterward, you can do all the necessary transformations (cleaning, reshaping, and restructuring) before loading it into your workbook as a single table. You can split, merge, filter, aggregate, unpivot, and so much more. It's faster, more intuitive, and less error-prone compared to writing formulas and scripts or clicking through menus.
On top of saving you the time-consuming task of manual data cleaning, it also makes updating it easy. If new data comes along or you notice a mistake, you just need to pop open the Power Query editor again, add, tweak, or fix what you need, and click one button to update everything. This would be a nightmare if you handled everything the traditional way. There's even a handy step recorder that allows you to track what you've done and remove the exact transformations you don't need.
Advanced data analytics and modeling
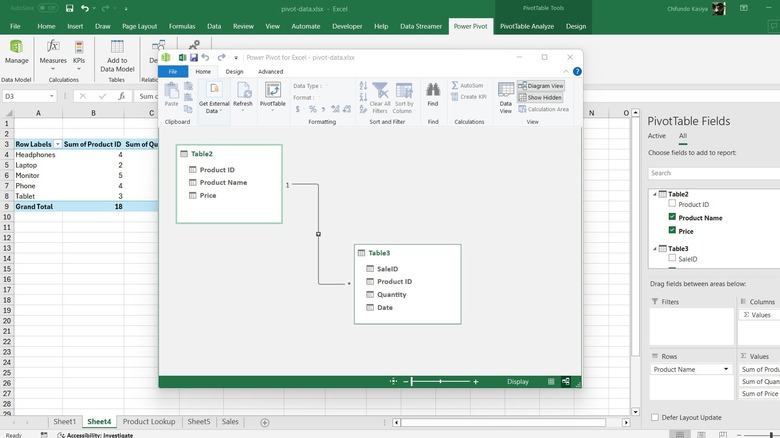
Excel has some great tools that allow you to analyze and model your data in ways that Google Sheets can't. A popular example is Power Pivot, and one of its core functions is to help you establish relationships between tables so you can build relational models. It works with PivotTables, which are an incredibly powerful way to summarize your data without writing formulas. If you have a sales table with columns like "Date", "Region," "Product Name," "Product ID," "Units," and "Sales," you can easily summarize "Sales by Region" with a few clicks.
You may have a separate lookup table with extra columns, such as "Price" and "Department," that you need to use for further analysis. In that case, you can use Power Pivot to establish a connection between the sales and lookup tables using a unique key (e.g., "Product ID"). Once linked, you can easily add columns from the lookup table into your analysis with a few clicks.
Another one of the core functions of Power Pivot is to perform custom calculations called measures using DAX (Data Analysis Expressions), the built-in formula language. With measures, you can create complex aggregations and analyses of your relational data model. They might sound complicated, but the DAX measures are usually a combination of Excel-like and specialized functions, and these respond to the filters you've applied to the PivotTable.
Advanced decision-making and forecasting tools
Another powerful analysis tool that Excel has that is not present in Sheets is the What-If Analysis tool. It consists of Scenario Manager, Goal Seek, and Data Table. These allow you to explore how different values affect the results of your formulas so you can make informed decisions. If you're not sure how a decision will impact your data, the What-If Analysis tools allow you to test your assumptions so you aren't guessing. They are a great way to make forecasts and see how you can achieve specific targets.
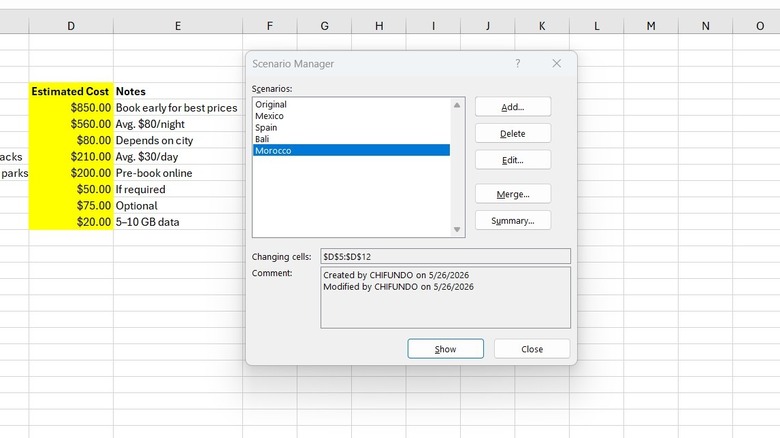
The Scenario Manager, for example, allows you to create a best- and worst-case scenario. Say you have savings and want to go on a vacation. However, you want to have as many savings remaining as possible at the end. Instead of creating multiple tables or sheets for each destination, the Scenario Manager allows you to create scenarios for each destination and test the various inputs (e.g., plane tickets, accommodation, food, and miscellaneous expenses) to see how they affect the results (leftover savings).
You can even create a report that allows you to compare everything side by side, so you can see the least expensive destination. Just with this one example, you can see how Excel can help with forecasting and decision-making beyond what Google Sheets or any free alternative can do. You don't even have to touch any formulas you've already written. When the inputs change, they will affect the results of all dependent formulas.