

Your Nest Thermostat Can Tell You Why Your Heating Bill Went Up - Here's How
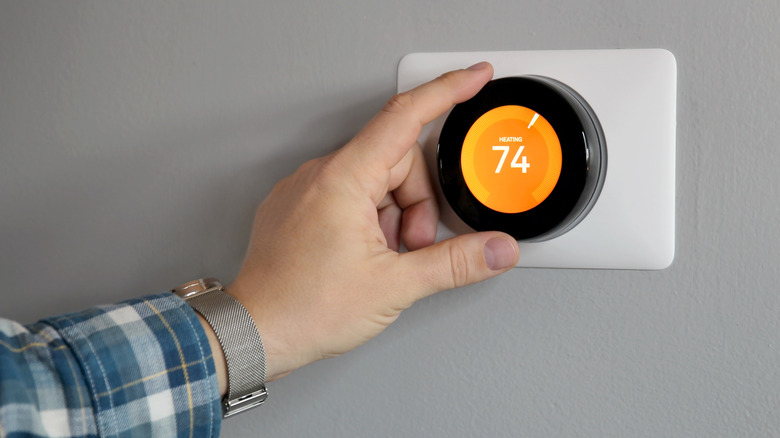
Winter weather may bring a wonderland of chilly delights, but it can also sometimes bring an unexpectedly high heating bill. While it's easy to just blame dropping temperatures and move on, trying to figure out what caused that sudden spike can mean lots of guesswork for you to wade through if you don't know for sure. If you have a Nest Thermostat, like the excellent Learning Thermostat, you'll likely be thrilled to know that the gadget actually has the tools to give you deep, accessible visibility into your home's climate control habits.
Specifically, Google Nest Thermostats have a built-in feature called Energy History. It's a tracking tool that's essentially a 10-day logbook of your home's HVAC system. So instead of just blindly guessing how often the furnace turned on and how long it ran for, the tool offers up hard data showing the exact runtimes. The feature makes it incredibly easy to understand how the temperature settings you choose affect how much energy your furnace uses (and thus, how high your bill is). Reviewing when the heat ran longest makes it easy to spot whether it was an unseasonably cold weekend or someone just got too fussy in manually bumping the temperature up and down. And checking your history regularly makes it possible to optimize when you turn on the heat and catch bad heating habits before they snowball into an enormous bill. It's a better way to manage your home heating costs.
Access and decoding your 10-day energy records

Getting to this data is a cinch. For most users, the easiest way is straight through the Google Home app. Head to the climate section on the main screen, then hit the Energy Dashboard. Selecting the daily view brings up the exact 10-day history needed to investigate why your bill went up. If you're using the dedicated Nest app, just tap the thermostat icon and hit History. Alternatively, you can walk over to the thermostat itself, press on the outer ring to open the Quick View menu, and find the same 10-day timeline right on the display. It's one of many things you probably didn't know Nest Thermostats could do.
It's not tough to make sense of this dashboard, as it uses a color coding system that's pretty straightforward: orange bars show exactly when your heating was running, while blue bars show cooling. Tapping any colored bar will reveal the total runtime for that period, making it easy to tally up all the hours shown on your bill. You might also see some helpful icons pop up that will tell you if there was extra-cold weather that day or if someone manually adjusted the temperature to make it work harder than normal. Either way, this eliminates much of the guesswork about why your bill was high.
That dashboard also rewards days you used energy more efficiently by displaying a green Nest Leaf. Earning these leaves is Google's way of gamifying energy usage, encouraging you to stick to more eco-friendly temperatures. And, of course, those more moderate temperature settings also help save you money and put less strain on your local power grid.